Showing posts with label economics. Show all posts

Monday, December 14, 2009

Brief: Which Western countries care most about preserving the media?

A recent NYT article reviews a German study of how willing people in various countries are to pay for "online content" -- news reporting, videos, songs, etc. In the German-language PDF linked to above, a table shows how people in the countries studied describe their preferences for getting online content. The columns read: free with ads, free with no ads, pay with no ads, pay with ads, and none of above. You can probably figure out what the country names are.

There's a fair amount of variation in how much of the population is willing to pay at all, or conditional on paying or not paying, whether they'll accept advertising. To see what explains this, I've excluded people who answered "none of the above," leaving only those who expressed an opinion. In the table below, I've lumped the two "free" groups together and the two "pay" groups together. I've also calculated a "delusional" index, which answers the question, "Of those who want free content, what percent expect it to not even have advertising?" Obviously someone has to pay for news articles to get written, and some free-preferers recognize that advertising is the only viable alternative to not paying for typical media products yourself. So, those who answer "free, no ads" are expecting media producers to behave like charities.

The table also shows GDP (PPP) per capita, on the hunch that richer countries will be more willing to pay for news, videos, and so on. In economics jargon, this online content is a "normal good" that sees a rise in demand when a population gets wealthier (an "income effect" pushes the demand curve up). The table is ordered from most to least willing to pay.

Country GDP / cap % Pay Delusional
Sweden 37,334 25 20
Netherlands 40,558 20 36
Great Britain 36,358 19 43
USA 47,440 18 27
Belgium 36,416 15 33
Italy 30,631 15 46
Greece 30,681 13 27
Bulgaria 12,322 12 41
Czech 25,118 11 56
Germany 35,539 10 56
Turkey 13,139 9 54
Romania 12,600 9 48
France 34,205 8 56
Portugal 22,232 8 52
Hungary 19,553 8 52
Spain 30,589 6 61
Poland 17,537 5 57


It sure looks like wealth plays a key role, so let's look at how GDP relates to both willingness to pay and how delusional the free-preferers are:


Since the willingness to pay and the delusional index cannot vary outside of the range [0,1], I use the Spearman rank correlation instead of the Pearson correlation. The correlation between GDP and the percent willing to pay is +0.67 (two-tailed p less than 0.01). Between GDP and the delusional index, it is -0.49 (two-tailed p = 0.05). People in richer countries are more willing to pay, and they are less deluded about where stuff comes from -- that is, typically not from charities.

The surprises are worth looking at. At the top, we see mostly Anglo and Nordic countries, and at the bottom the more southern and eastern parts of Europe. However, France ranks pretty low, and Germany doesn't do much better, even though we Americans think of those countries as having more sophisticated media tastes, and as treasuring the institutions of the media -- Gutenberg in Germany, for example. We also think of ourselves as much more bratty when it comes to the media -- that because our sophistication level is so low, we're only a tiny bit willing to pay, and any more than that we'll junk the news in favor of some other cheap form of entertainment.

It looks like the ones that have more pro-market views are more supportive of paying for online content. The French and Germans may like the idea of keeping the media alive and thriving, but Americans are more willing to do what it takes to ensure that happens.

Wednesday, November 11, 2009

Brief: When statesmen weren't elderly

A book that I'm reading casually mentioned that the English politician Bolingbroke became Secretary at War in 1704 -- at age 26. When something seems like it's from another world, it probably reflects the massive changes that the West has seen since making the transition to a society characterized by open entry and competition in both the economic and political spheres. To check this, I've plotted over time how old the entering British Secretary at War was (or whatever new title he may have had, such as Secretary of State for Defence). Here are the results:


Sure enough, up through the first quarter of the 18th C., the Secretary at War's age hovers around 30. By the end of the century, his age has moved to the upper 30s and 40s. During the 19th C. there is more variance, with a handful of Secretaries in their early 30s, but the trend is still upward into the 40s and 50s. After 1900, the youngest has been 38, the oldest 73, with the average at 52. The men with heavy war responsibilities are about 20 years older in post-industrial than in pre-industrial times.

One reason may be that everyone started living longer with industrialization, not just the statesmen. But when you think about it, that cannot explain things. Presumably the 17th C. counterparts of today's lead singers of a rock band were also in their 20s. Elite athletes were likely also in their 20s, as they are today. If there were supermodels back then, you can bet they would have been in their 20s as well. Instead, there has been a shift in what type of people are considered fit for war secretary, which in turn reflects a change in the job description itself.

Violence and Social Orders, the book I'm reading, posits a framework for understanding history through the lens of controlling violence. In a primitive social order, such as those of hunter-gatherers, there is continual violence, no state, and mostly no social organizations beyond kin networks.

The limited access order (or "natural state") controls violence by using the state to create rents for elite members of a dominant coalition. Each elite gets his own piece of turf to extract rents from, and each elite respects the turf of the others because otherwise violence will break out, and that disorder would destroy the rent-creation. To make sure that the rents are sufficient to persuade elite members to refrain from violence, access to the elite is restricted -- if it were open, lots of people would pour in and shrink the amount of the rents going to each person. Still, the shadow of violence always looms over the society, since the means of violence are spread out over the entire elite -- not monopolized by the state -- and they only refrain as long as no one trespasses against them. The threat is always there.

Open access orders are the ones we live in today, where there is political control of the military, the state is used to provide public goods for the masses rather than private rents for the elites, and where the economically powerful earn their money through profits -- doing something productive -- rather than parasitizing rents from the peasants under their control. Violence is rare because the state monopolizes the legitimate use of violence, rather than every elite member being a violence specialist himself or closely allied with one. Elites compete on the basis of the price and quality of the goods and services they provide -- not based on who can defeat whom in a violent battle.

My guess for why open access orders have older statesmen is that since the shadow of violence has been largely removed, you don't need people running military affairs who are itching to pick up arms and go kick some ass. Being a hormone-crazed young person is great in a natural state -- your hair-trigger emotions are suited to a world where you always have to be prepared to fight, and your choleric temper provides a credible threat to would-be trespassers during peacetime. For example, Alexander the Great became King of Macedon at 20 and had conquered much of the known world by his death at 32.

But in open access orders, violence has been stripped from the broad elite and concentrated in the state, and civil war -- that is, intra-elite war -- is rare. So, too, are elite uprisings against the state -- before, these resulted from elites losing their rents and going after the people who were supposed to be providing them. So in these societies hot-headed young people are only going to threaten the peace. The elites are no longer constantly prepared to battle each other, so we only require a calm person to make sure everyone continues to get along. A 26 year-old in charge of the army, by contrast, would grow bored with peace so quickly that he'd want to stir things up "so we at least have something to do."

It's funny that we worry today about how to control young males' violent impulses, which threaten the peace. Only 300 years ago, we would have been grateful to have a young violent male in our social circle -- he would've been extracting rents from us, but at least we'd have someone to protect us from all those other specialists in violence. We truly live in a different world.

Monday, November 9, 2009

Brief: Generational views of communism

On the 20th anniversary of the fall of the Berlin Wall, let's take a look at how the various generations viewed communism.

The General Social Survey asked a question from the early 1970s through the mid-1990s about your view of communism. I've restricted the respondents to those between the ages of 18 and 30 to make sure that we're looking at those most prone to idealistic foolishness of one stripe or another. The generations I've chosen are earlier Baby Boomers, later Baby Boomers, the disco-punk generation (perhaps Second Silent Generation is better), earlier Generation X-ers, and later Generation X-ers. Here are the results:


I knew beforehand that those born between the two most recent loudmouth generations (Boomers and X-ers) would be the least sympathetic to commies because they came of age during a decidedly non-ideological period -- roughly the late '70s and early '80s, in contrast to the highly ideological Sixties and early '90s that the other two generations grew up during. Young people during the social hysterias felt compelled to embrace the larger world in order to change it for the better, while young people during a period of relative social calm felt like telling the larger world to go get a life of its own, leave us alone, and let us have fun.

I'm putting together a more detailed post about generational differences in voting patterns across the years, so stay tuned.

Sunday, November 1, 2009

Brief: Too smart for their own good or just showing off?

Returning to the theme of whether people favor policies that benefit their narrow self-interests, let's have a quick look at who says the government should provide a minimum income. The self-interest view says that as people make more money, they should be less likely to favor such a policy -- they earn too much to qualify, and they'd pay for it through higher taxes. Indeed, that's just what the GSS shows, whether we look at real income or self-described class. Here are the results, where red is support, blue is neutral, and green is reject:


But what about support for the policy based on your brains? The self-interest view predicts the same pattern as above -- college graduates are very unlikely to qualify, yet they'd have to pay higher taxes to fund it. And in the GSS, real income increases steadily as your intelligence increases (data not shown here), so we'd expect smarter people -- who are also wealthier people -- to want the policy less. That's mostly true, except at the very high end:


Support for a minimum income policy decreases as you poll smarter and smarter people -- until you reach the high end, who get 9 or 10 out of 10 questions correct on a makeshift IQ test. Similarly, support erodes as you poll more and more educated people -- until you reach the high end, who have more than 2 years of post-graduate study (i.e., not just a masters but a doctorate).

You might think that overly brainy or overly educated people make less than those just below them -- think of the English PhD who works at Starbucks -- but remember that using this measure of IQ, the upper end makes more money than those just below them. You might also think that the high end has simply been exposed to more silly ideas -- again, think of the English PhD who had to read some Marxist stuff for his theory classes -- but why doesn't this hold for those with 1-2 years of college, 3-4 years of college, or who hold a masters? Surely they've been more exposed to silly ideas than those just below them, and yet they are less and less likely to support the policy. And remember that the reversal also shows up in IQ, which just measures how smart you are, rather than how much time you've spent listening to professors.

So perhaps there is something to the idea of people at the upper end of the intelligence scale being "too smart for their own good." Minimum income policies will keep more poor and low-skilled people out of work because an artificially high price (i.e., a wage or salary higher than what employers and workers would agree to) means that employers won't offer as many jobs as they would if the wages were somewhat lower. As people have more intelligence to see this -- or at least sense it intuitively -- support for the policy generally drops off. But maybe being at the upper end makes people arrogant -- "Well, that's the obvious answer, so it can't be right. There has to be a more complicated and different answer!"

Alternatively, the high end could be trying to signal their braininess -- "I'm so smart that I can hold all sorts of ridiculous views and not suffer any consequences." Why don't people on the high end of income and class try to signal their status in the same way? Because income and class are more acquired traits, whereas differences in intelligence in modern societies mostly reflect different genetic endowments. If you're trying to signal how good your genes are, the trait that you claim to be so high on -- "I'm so X that I can afford to..." -- would have to show a strong genetic influence.

These data don't allow us to decide between the two main explanations, but they do rule out the strong version of the self-interest view.

GSS variables used: govminc, realinc, class, educ, wordsum

Monday, October 19, 2009

The robber barons slashed prices, boosted output, and saw eroding profit margins

One of the lessons we take away from our high school and college history classes is that during the latter half of the 19th C. America was ruled by robber barons -- powerful businessmen who wielded nearly monopolistic power over the hapless little guy, riding roughshod over the entire society for want of regulatory restraints. That all changed when populist and progressive politicians and muckraking journalists exposed the abuses of Gilded Age and turn-of-the-century industrialists.

Like most folktales, though, it bears little resemblance to the truth. Its function is instead to provide a creation mythology for contemporary regulators to justify present-day attacks on so-called robber barons. I've gone through data on railroads from a turn-of-the-century edition of the Statistical Abstract of the United States, and right in the middle of all of that populist and progressive agitation, it was totally clear that they were pushing an image of the world that was completely backwards. If powerful monopolists are harming consumers, we should see output shrinking and prices soaring. If they were gouging consumers, they should have seen ever greater profits over time -- again, until they were restrained by the government. This approach also allows us to test whether the antitrust legislation had any beneficial effect -- we can just look at what was going on before and after it was passed.

I've chosen railroads because the Wikipedia article on robber barons shows that most of the outrage was directed at railroad magnates -- they are more represented in lists than are captains of other industries. Let's first take a look at output. Imagine De Beers, which used to control almost all of the world's diamond supply, responding to lower revenues -- they'd simply choke off the flow of diamonds into the market, so that diamond buyers would compete more intensely over an artificial shortage of diamonds. Here are graphs showing the total number of miles of railroad in operation, the number of miles added each year, the number of passengers carried, and the amount of freight carried:


The antitrust era began more or less in 1890 with the Sherman Act. Before this time, output did not contract. There is stagnant output from about 1830 to 1850 while the industry is in its infancy. After 1850, though, there may be cycles up and down, but the clear trend is toward steadily greater output over time. If anything, the decade after the Sherman Act was passed saw shrinking or stagnant output. The number of passengers served and the weight of freight carried also rose steadily at least from the early 1880s for the next decade (earlier data are not available). The picture after 1890 isn't clear, but we can rule out a beneficial effect of the Sherman Act, which would have sent the numbers steadily upward and at a faster rate than before. Remember, the trend was already increasing before 1890.

This behavior is the opposite of a monopolist who would want to only serve fewer and fewer people. Imagine if the Super Bowl organizers sold 1000 fewer tickets year after year -- prices would skyrocket. So, these three separate measures of output show that railroad owners behaved in the opposite way of monopolists -- they kept giving consumers more of what they wanted.

We might predict from this that prices that consumers paid would have fallen as a result of expanding output -- when there's a glut of stuff, people prefer to pay less for it. The evil robber baron picture predicts that prices should have shot up. Let's see who is right by looking at freight rates on wheat per bushel (in dollars), while comparing rates across three types of transportation:


Water-only transport became nominally more expensive from the early 1850s through the late 1860s, although this is not adjusted for inflation. The key is that it began falling sharply from the late 1860s through the late 1870s, fell a bit more shallowly for another decade, and declined very modestly after 1890. Here is a completely different method of transportation -- by water rather than over land -- and we see falling prices. So at least owners of water transport were not monopolists. Was the story any different for the rates that railroad owners charged? Not at all: we see the same pattern of rapid decline from the late 1860s through the late 1870s, modest decline for another decade, and very slow decline after 1890. Again, we see no effect of the Sherman Act -- if anything, the antitrust era saw slower price decreases.

So, railroad magnates were the opposite of monopolists, boosting output and charging lower prices over time. Still, we might salvage the picture of bloated industrialists by looking at their profits -- you could charge lower prices and make up for it on volume. Alas, when we look at how much money they brought in for carrying either passengers or freight for a mile (in cents), we see that railroad owners pocketed less and less dough:


Whether it was from freight or passengers, railroads received less and less money from at least the early 1880s onward, again with no sign of the Sherman Act in the data. The leading railroads have data going back farther, and they show falling revenues going back at least to the 1870s. Here too we see that the antitrust era that began in the 1890s was associated with a slower rate of declining revenues. In fact, the robber barons took their biggest clobbering of the Gilded Age during the 1870s, decades before there was any substantial elite outcry to rein them in.

That is exactly what we expect from a new and highly profitable industry -- once businessmen hear about how profitable it is, more and more will enter it, and the resulting bitter competition will drive down profits until the industry is no more profitable than a typical industry. If you were one of the lucky initial railroad owners back in the 1830s, you may have made a pretty penny for the moment when you had little or no competition. But at least by 1870 -- and probably somewhat earlier -- that brief period of uncolonized paradise was long gone. The magnates saw leaner and leaner profit margins, while consumers saw more and more miles of railroads that could carry them and their stuff for lower and lower prices.

Not to put too fine a point on it, but a lot of what we learned in school about businessmen was utter nonsense. If we taught facts, we would teach kids that the robber barons kept giving their consumers more of what they wanted and at lower prices -- and these data don't even factor in the consumer benefits of enjoying improvements in quality that railroads implemented as they grew from newcomer to mature industries. A railroad trip in 1885 was more pleasant than a railroad trip in 1845. And all the while, they made less and less money on these ventures, rather than fatten themselves up by abusing their power, which they clearly had very little of.

The facts are not hard to understand, so that's not the reason that they aren't taught. Indeed, the teachers themselves don't know these facts because they're not taught in intro college history classes either. The idea that captains of industry were ruining the lives of ordinary people can be very easily tested with data available to anyone with an internet connection, and the results show that our received picture of the world is not just a little bit off but completely wrong. As I said earlier, this mythology about the dark demons known as robber barons and the angelic saviors called populists and progressives is really just another creation myth. Like other such myths, it merely rationalizes the will of the group that is currently in power -- namely, the government and particularly the regulators.

"Why do those people have jobs, teacher?"

"Well, you see Jayden, if we didn't have them, darkness would descend over the land. Let me tell you the story of how the world used to be before the antitrust regulators arrived to deliver us from the wickedness of the robber barons..."

This fake picture we have extends to other industries as well -- I got the idea for this post by learning about the history of Standard Oil, which also was responsible for higher output, lower prices and profits, and saw its market share erode over time. In the popular-audience stuff, I haven't seen much discussion of railroads, although there may be academic articles on the topic. The most important thing here is the graphs, which you rarely see even in journal articles. You're lucky to see full tables. Here, the pattern jumps out at you, showing just how ridiculous the stories we've been told are.

Wednesday, September 30, 2009

Brief: Are Jews who marry outsiders duller?

For much of their history, Ashkenazi Jews practiced endogamous marriage, sticking mostly with their own. It was incredibly difficult to marry in, although nothing would prevent a person from leaving the group by marrying out. Given the almost exclusively white collar niche that they occupied for centuries, it is worth asking whether or not the Jews who left were duller than the ones who stayed -- perhaps they couldn't hack it as a tax farmer and moved on to being a potato farmer.

Obviously we cannot look up IQ data on Medieval Ashkenazi Jews, but we can at least look at contemporary American Jews to give us a hint. The General Social Survey asks questions about your religious preference and that of your spouse. I restricted respondents to only Jews and then looked at the mean IQ of Jews with Jewish spouses (endogamous) vs. Jews with non-Jewish spouses (exogamous). To get big sample sizes, I tried two different questions about your own religion -- what it is currently, and what it was at 16. The results are the same.

Endogamous Jews score 0.03 - 0.04 S.D. higher than exogamous Jews. That's an incredibly puny difference -- it's as if the endogamous were one-tenth of an inch taller than the exogamous on average. I looked at level of education, and that too looked similar.

But although endogamous Jews may not be much smarter than exogamous ones, they do earn more and are higher-status:


Neither group of Jews has many lower-class members, and they have the same proportion who are middle-class. However, 20% of exogamous Jews vs. 12% of endogamous Jews are working-class, and 7% of exogamous Jews vs. 17% of endogamous Jews are upper-class. As for income, both groups have similar proportions that earn less than $20K or more than $100K. However, 39% of exogamous Jews vs. 29% of endogamous Jews earn between $20K and $50K, and 26% of exogamous Jews vs. 33% of endogamous Jews earn between $50K and $100K. The median income for exogamous Jews is between $44K and $46K, while for endogamous Jews it is between $50K and $52K.

So, among contemporary Jews, those who marry within their group may not be smarter than those who leave, but they are wealthier and higher-status. Those who marry out, therefore, couldn't (or didn't want to) apply their equal level of intelligence to acquire as much material success as other Jews, and left for less competitive niches, brides with less lofty financial expectations, or something else.

Whether or not this is what happened when Ashkenazi Jews left their group to join their Eastern European host populations, we can't say for now. But it doesn't seem unreasonable -- only so many people can be high-status within a group, so the rest -- brainy or not -- will have to look elsewhere to find success. One big difference then was that wealth and status mattered a lot more for passing your genes throughout the generations, so -- if the current pattern held back then -- the endogamous Jews would have had a Darwinian advantage over the poorer ones who married out.

GSS variables used: sprel, relig, relig16, wordsum, educ, class, realinc

Thursday, September 10, 2009

What predicts income dissatisfaction?

Let's test the idea that as people attain higher status, they believe that their income is increasingly not enough to cover their expenses -- after getting that big promotion and moving to a better neighborhood, you've got more income, but it sure seems like life is more expensive, what with the private tutors and sports coaches for your kids, higher home prices, replacing the IKEA furniture with stuff from Crate & Barrel, etc. Life felt more affordable before.

The General Social Survey asks the following question:

Do you feel that the income from your job alone is enough to meet your family's usual monthly expenses and bills?


Note that the wording does not refer to things in the "take only what you need to survive" category. If you pay for tutoring, that's a usual monthly expense. If you go out to McDonald's several times a month, that's a usual monthly expense. So it's referring to whether the person's income is enough to support their broader lifestyle.

If the above idea is right, the percent who answer Yes should decline as we go up the status scale. In fact, the effect should be especially strong since this question was only asked in 2002 and 2006 -- right before the recent boom, and then during the height of the boom. People were furiously maxing out their credit cards, and they were surrounded by other people with lots of cool new stuff that they bought using maxed out credit cards. A feeling of income inadequacy at the higher status levels should have been particularly acute.

Out of curiosity, I also checked to see how income dissatisfaction varied within other demographic groups. Here are the results (click to enlarge):


The lowest income groups are the least satisfied, although once family income hits $20,000, dissatisfaction stays pretty constant. However, the very rich actually feel even more satisfied than other income groups. The same pattern holds for job prestige (socioeconomic index), education level, and self-reported economic class. Income dissatisfaction is basically constant across IQ levels (the lowest levels, 0 - 2, show funny results because of very small sample sizes). So, there is no evidence that higher-status people -- however measured -- are more bitter about their income level than lower or middle-status people. Quite the opposite.

As for age, surprisingly there is no big change from the college years through middle age, although by the time people are in their 60s, they are a bit more satisfied than before -- perhaps due to the falling need for social preening and oneupsmanship by then. Before then, though, more than 50% of each age group feels inadequate -- just unhappy in its own way (not getting a hot car when young vs. not finding a nice home when older).

Also surprisingly, there are are no race differences at all. We might have expected whites to feel more satisfied since they score higher on average for the above measures of social status. I fooled around by restricting the social status variables to the higher end or lower end, and it didn't seem to matter -- blacks and whites were still basically dead even. What they spend their money on may differ, but no racial group feels more or less satisfied than any other.

Finally, there is a gigantic sex difference, dwarfing anything else we've seen. While 57% of men are satisfied with their income, only 34% of women are. We can't attribute this to women wanting to shop more, or for more expensive things -- men have their eyes on super-expensive cars and other auto-related junk, amateur sports equipment, big flashy gadgets and electronics, and so on. And men don't make that much more than women, so it can't be due to differences in income. I think it must be a personality difference rooted in the brain's wiring. In questionnaires, women consistently score much higher on the personality trait Neuroticism than men. And this shows up in the real world, as they suffer more from depression than men. The feelings of anxiety, self-doubt, and impulsiveness that characterize Neuroticism should show up when we ask people if they're satisfied with their income level.

These other demographic findings are pretty neat, but the most robust and important finding is that income dissatisfaction does not increase as you move up the status scale. We may have this misperception because those higher-status people who are not satisfied are the ones most likely to speak up about it, and the ones who the media are most likely to cover because of the schadenfreude value it provides the readers with. No one wants to write or read a news feature on a bunch of people who say, "I'm rich and educated -- and it is all it's cracked up to be!"

GSS variables used: rincblls, race, sex, age, class, sei, wordsum, educ, realinc

Monday, September 7, 2009

Has the free market been taken too seriously or not seriously enough?

In a recent essay in the New York Times Magazine about why so many economists failed to predict the current crisis, Paul Krugman argues that a big piece is the cheerleading of Panglossian free marketeers, which helped to hide from view the possibility that markets can screw up, perhaps in very disastrous ways. Sure, there were a handful of skeptics and nay-sayers, but according to Krugman, they were too small in number or decibel level to get the attention of mainstream economists.

Not knowing much about the history of economic thought, I decided to see for myself by searching the "economics" section of JSTOR for articles that discuss markets failing. If Krugman's right, these should either be low in absolute number (whether they're up or down, they aren't enough to get people's attention), or if they're high in number, they should have been declining (as the cheerleading swept across the profession).

I've previously shown that the idea of money illusion declined in popularity from the mid-1970s onward, which is more of the kind of imperfections that Krugman is talking about. I could look for other ideas related to behavioral economics or behavioral finance, but these focus on how psychology affects economic behavior. I'm not sure they're the best measure of how common are ideas about the market failing. So, I looked instead at market failure ideas related to information -- these don't imply a wrinkle here or there due to some quirk of psychology, but to larger market failures. The most well known example is George Akerlof's hypothetical example of "the market for lemons" (used cars).

The phrases I searched for are "asymmetric information," "adverse selection," and "network externalities." I threw in "irrational exuberance" out of curiosity. If those terms are unfamiliar, I can't explain them at length, except to note that they are hypotheses about how markets can fail. (For instance, if the buyer knows something the seller doesn't, or vice versa; or if people value a technology not only for its use to them as individuals but also in relation to how big the network of users is.) They have Wikipedia entries, though.

I standardized the counts first by dividing by the total number of articles, which gives the % of all articles containing the keyword. This just tells us how prevalent the idea is, but it may be more useful to standardize by comparing the counts of the market failure ideas to the counts of articles that mention some completely basic idea in economics. That way, we can see how much respect the new ideas are given relative to time-tested ones. (It is like a person in 1997 comparing the stock prices of the dot-com companies to stocks in more mature industries.) I chose "supply and demand" as the fundamental concept to compare them to -- that's about as basic and popular of an economic concept as you can think of.

The pattern looks the same no matter what I use as the standardizing term, so I've stuck with the % of all articles measurement for all terms, although I've also included a graph with the comparison to "supply and demand" for two keywords to show just how much attention they have been given. Here are the results:


Clearly these ideas have only been gaining in popularity among economists. Indeed, the pioneers in this line of hypothesis-generating have received the Nobel Prize in economics for this work -- an event that should make us skeptical of Krugman's claim about how clueless economists have been, re: the possibility of markets screwing up. The broadest terms are currently pushing around 10% of all articles -- not too shabby. Moreover, since the late 1990s, the idea of "asymmetric information" has been on par with or even above the idea of "supply and demand" in how commonly discussed they are. It's hard to imagine beating "supply and demand" in a popularity contest, but there you have it.

(Indeed, perhaps it is the infatuation with such ideas that blinded many economists to basic concepts like supply and demand -- for instance, that housing prices were shooting up because demand was shooting up, as it does during a bubble, not because of some radical shift in the interest rate, construction costs, or population size, as Robert Shiller showed years before the bubble burst.)

Krugman did not claim that if only economists had paid more attention to market failure theories involving asymmetric information, they would've seen the crisis coming. But his broader claim about how sanguine the profession had become about the superiority of markets and the small chance that they'd screw up big -- this claim is wrong. Asymmetric information economists and behavioral economists have recently won the Nobel Prize, and we've just seen that the former ideas have only gained in popularity, rivaling even the respect given to the concept of "supply and demand"!

I think the poor showing of economists is not due to theoretical blinders so much as it is to their desire to fit in with polite society (which in turn may influence what theoretical hunches they have). No one wants to rain on the parade during a boom or period of apparent great moderation. Others will take offense, turn them out, and so on. The two economists who had the most foresight, Robert Shiller and Nouriel Roubini, don't care how well accepted they are. Shiller's mind is that of an engineering nerd, which doesn't register a social faux pas very sensitively. And Roubini is someone who gets a thrill out of telling other people how stupid or clueless they are (this is the main appeal for academics in many fields). So obviously he won't care if he's an outcast.

Many view economists as asocial or autistic nerds, but that doesn't seem to be so true -- they have fully functional and thirsty social antennae, but they were the ones left out of the cool kids crowd in high school, and who desperately want to be part of respectable society as adults. Hence all their name-dropping about Mozart, Picasso, exotic cuisine, and which neighborhoods in Zagreb are the most authentic. "See, we're not just a bunch of math geeks! Let us join the party!"

Clearly seeing the current crisis would have required them to call polite society a bunch of idiots -- for believing that home prices can only go up, up, up -- or recklessly ideological for using PC to debauch lending standards. Not the best way to get invited to the right dinner parties, the board of directors at the right institutions, or the conferences of right-thinking society.

Monday, August 31, 2009

Youthful exuberance: Age and the housing bubble

The internet does not produce any non-self-referential data; it simply makes the data easier to find and faster to obtain. Still, if this drops below some threshold, some people might get into investigation who might not otherwise would have bothered -- and that's as good as producing new data, since unexamined data do not really exist. Probably the best result of this is the ability of people with computers to figure out if a popular story is true or not.

One story that was everywhere in the media not too long ago -- although it has probably since been crowded out by all the news about the collapse of the global economy -- was that young people today refuse to grow up. In particular, they were supposed to be opting more than ever before to live at home and freeload off their parents well into their 30s. This story broke into the mainstream when Time Magazine ran a cover story about twixters, the goofy name for these aging slackers. Around the same time, MTV devoted an episode of True Life (a popular hour-long documentary show with different topics each week) to young people who were moving back with their parents.

These stories were circulating during 2005, at the height of the real estate euphoria, so the inference is that young people were being left out of the housing bubble. The greatest beneficiaries must have been older people starting a family, or perhaps middle-aged speculators looking to "flip that house." But rather than take the tales at face value, let's see how well or how badly the bubble treated young people, using housing data from the Statistical Abstract of the United States, which begin in 1982 and go through 2007.

First, here is the distribution of homeowners by age, using coarser and finer-grained age groups:


It would seem from the first chart that homeowners were becoming grayer, but the youngest category is pretty wide -- "under 35." Looking at the finer-grained chart, we see that those under 30 seemed to be doing pretty well, especially since their low in the early 1990s. This looks especially true for the under-25 group, but it's hard to see in the chart. To get a better view, here is the homeownership rate for the under-25 age group over time:


Indeed, they were treated quite well by housing bubble that began in the late 1990s. Just eye-balling it, there is a gain of about 10 percentage points -- or about a 67% increase. But maybe they were nothing special, and the other age groups had similar increases. Let's have a look at how their rates changed from the early-'90s low to the peak in the mid-2000s:


The middle-aged age groups and above tend to have homeownership rates of at least 70%, often 80% or higher, so there is only so much room for them to gain before they hit 100%. That's why their increases aren't so great. The increases among the elderly reflect a steady increase since 1982, unlike the ups and downs that every other age group went through, so they're a different story.

But for the younger age groups, all of them had lots of room to gain, and yet it was still the very youngest whose rates shot up the most in relative terms. Clearly we were all fed a bunch of bull about 20-somethings refusing to make it on their own, mooching off their parents forever, and so on. A priori, that story should have sounded implausible since the 20-somethings of 2005 had come of age during two frenetic economic booms separated by a quite tepid recession. It sounds instead like the world was their oyster.

(I was a mid-20-something living and working in Barcelona at the time-- something I couldn't dream of doing now, with the Spanish economy in ruins. And even though housing became cheap after their real estate bubble burst, it wouldn't be any fun this time around since the euphoria has dissipated.)

How can we get a good intuitive feel for how spectacular the housing bubble was for young people? Let's compare their percent increase in homeownership rates to other not-so-credit-worthy groups. Many commentators have pointed to the increase of homeownership among Blacks and Hispanics, but their rates only increased by just over 10% and 20%, respectively. They started fairly low too -- not like the middle-aged -- so their increase was similar to the 25 - 29 and 30 - 34 age groups. Nothing close to the gains of the under-25 group. The same is true for single mothers, whose rates increased by under 20%.

As far as I can tell, young people were the greatest beneficiaries of the drive to debauch lending standards, especially the move to do away with down payments. After all, how much money could you have saved up by that age to put down? Forget the fact that what little you did earn you probably piddled away on your car, electronics, beer, shoes, handbags, and so on.

These data underscore the importance of paying attention to age as a demographic variable, something that we rarely do, except to whine about how youth-obsessed our culture is (or is becoming). That's not true either, but in any case, we already have lots of analysis based on race or ethnicity, sex, class, and even sexual orientation. Age is typically a far stronger cause of differences than any of those, yet we neglect it too often. This may reflect how homogeneous our social circles are by age, so that differences across age groups don't automatically spring to mind. Still, we should make a conscious effort to pay better attention to age when trying to figure out how people and their societies work.

Saturday, August 29, 2009

Brief: Have we gotten more or less sympathetic since Adam Smith's time?

In his Theory of Moral Sentiments, Adam Smith made the observation that we care less about the disasters that befall others if they are remote and faceless, while we panic at much smaller hardships of our own. But he wrote that before the Industrial Revolution really took off, and so before the peace-and-life-valuing merchant classes genetically replaced the old warring aristocratic class. In the meantime, capital punishment has been widely banned across Europe and its off-shoots, we have laws against cruelty to animals, and we have TV and other media that provide us with vivid daily images of the troubles that beset people in far-off places. So, does his observation still hold up in our more bleeding heart times?

To check this, I searched the NYT for its coverage of a rival first-world country, Japan, and a non-threatening third-world country, Indonesia. If newspapers cover a country out of sympathy for their plight -- and this supply would reflect demand for such coverage -- then there should be declining coverage of Japan during their incredible boom of the 1980s, but increasingly more coverage as they slid into the Lost Decade of the 1990s and even early half of the 2000s. Similarly, coverage of Indonesia should spike during 2004 - 2005 in the wake of the disastrous tsunami, which hit Indonesia much harder than other countries. (This event was pretty close to Smith's hypothetical earthquake that swallowed all of China.) There should also be a spike during their financial crisis of 1997 - 1998, although this was not a deadly catastrophe that could provide the level of gory detail as a tsunami, so this spike should be smaller than that of the tsunami coverage.

Here is the NYT's coverage of these countries:


Counter to the sympathy hypothesis, coverage of Japan shot up during the 1980s, as Americans began to fear more and more that Japan was going to economically take over our country. When Japan slid into a long recession, those fears evaporated, and the supply of alarming stories declined as a result, all the way to the present. This is not to say that there was no demand for sympathy stories about the Japanese recession, only that fear is a stronger driver of coverage than sympathy.

The Indonesia data give some support to the sympathy hypothesis. There is indeed a two-year increase for 2004 - 2005, reversing a previous steady decline. After that moment of sympathy, though, coverage starts to decline again. Moreover, the upward blip during the tsunami is tiny compared to the skyrocketing coverage of 1997 - 1998, when Indonesia was rocked by a financial crisis. This reflects our panic that the Asian Financial Crisis would infect our own economy. Before this threat to us, we paid relatively little -- and consistently little -- attention to Indonesia.

On the whole, the coverage data support Adam Smith's claim, despite our being more emotionally sensitive than people were during his time. However, there is no real paradox here if we view the demand for sympathy stories -- and the coverage that supplies that demand -- as a function of both some baseline concern for others plus a component that responds to actual disasters. Let's say that sympathy is a simple, linear function of disasters:

S = b + r*D

Where S is level of sympathy, b is our baseline level in the absence of news about disasters, D is the level of disasters that we hear about, and r measures how responsive our sympathy is to those disasters.

All that Smith was saying is that r is greater for disasters that are nearer to us than for disasters that are more remote. He made no claim about our baseline level. The genetic and cultural proliferation of the merchant classes -- and the concomitant doing away with public executions, slavery, etc. -- may have increased the baseline without affecting how r responds to disasters at different social distances. This seems like a useful distinction to draw, as it clears up a lot of the confusion about whether we've become more selfish or sensitive in recent centuries.

Tuesday, August 18, 2009

The rate of invention from 0 to 2008 A.D.

A quick update: in case you didn't see, there is now a table of contents on the right, with links to each post, as well as an index of categories that I've written about, in order to ease browsing.

Moving on, here is a much more detailed follow-up to a GNXP article I wrote about the slowing of innovation after the government downsized or busted up the two main sources of invention in recent times -- AT&T's Bell Labs and the Department of Defense -- over concerns about monopolistic entities. Try to think of something invented after Bell Labs was broken up in 1984 - '85, and that would pass the "telling your grandkids" test. Is it something they will continue to use, or if not, something they would still find really neat? The compilers of "lists of really important inventions" truly struggle to come up with such things invented in the last 25 years, and typically they're highly derivative of other entries -- for example, including not just the cell phone, but the digital cell phone, and even the particular model of the iPhone!

Now let's put this decline in a greater historical perspective. After all, perhaps we could only expect to have one really good run, this run happened in the mid-to-late 20th C., and that's it. Something like the technological Renaissance. Well, we'll see. In contrast to the book that I used before -- Big Ideas: 100 Modern Inventions that have Transformed Our World -- there's a new book out called 1001 Inventions that Changed the World. Instead of starting in 1940, it begins far back into human evolution, including stone tools, clothing, and so on. Plus, it obviously has 10 times as many data-points. There isn't a whole lot before the Common Era, so I've restricted the dates to lie between 0 and 2008 A.D., leaving 855 data-points. (It took a few trips to Barnes & Noble to copy them all down!) It's written by several authors, so there is little chance that the entries reflect an eccentric's view. Flipping through it, just about everything made sense (again, with the exceptions of some desperate attempts to include very recent inventions).

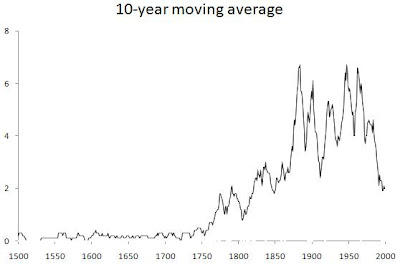
It's not clear what the time scale should be for technological change, so I've included time series graphs at several time scales. They all show roughly the same picture, although fitting a model to these data would show less error in some rather than others. The time intervals are century, half-century, decade, year, and a 10-year moving average of the yearly data to smooth them out. The points for century, half-century, and decade are plotted at the mid-point of the interval (e.g., at 1825 for the decade of the 1820s). The y-axis measures count of inventions. Here are the results (click to enlarge):


If you just looked at the century-scale data, things would look pretty good! Starting in the Early Modern period, there's an accelerating increase that really takes off during the Industrial Revolution and apparently continues straight through the 20th C. Sure, the most recent increases shows diminishing returns, but maybe we just had a mediocre century and things will bounce back.

Unfortunately, zooming in to just the half-century-scale data gives us reason to be pessimistic. Here we see an S-shaped curve (such as the logistic) that clearly shows a near-saturation of the rate of invention. Focusing even closer to the decade-level data, the picture looks even gloomier and confirms the picture I presented in the previous GNXP post: after a fairly steady increase, there is something of a plateau (or perhaps two peaks) lasting from 1885 to 1975, after which there is a 30 year-long plummet to the present.

This recent decline is visible even at the yearly level: you can see the heavily shaded curve dip steadily downward toward the end. In the smoothed 10-year moving average graph, this stands out even more clearly. The peak is around 1984, and there is a steady decline afterward until the latest value at 1998. Now, there are certainly other periods of decline in this graph, but to find one that lasts so long, you have to go back to the decline from roughly 1790 to 1810. And the sheer magnitude of the drop is right up there with the other declines of the past two centuries. Things are not looking so good.

Ignoring the overall rise-and-fall trend, there is an apparent 20 to 25-year cycle, judging from the distance between peaks or between valleys. That's the length of a human generation, although this may be a coincidence. If not, then this would reflect generational changes in how encouraging of innovation the society is -- if they want plenty of cool new things, they may have to trade that off against increasingly monopolistic bodies like AT&T. Conversely, if the zeitgeist is for breaking up corporations that are "too big," the invention rate may suffer. Perhaps the sharp drop starting around 1905 was due to the Progressives and muckrakers.

Whatever the mechanism, it is clear that there need to be at least two groups interacting dynamically -- otherwise we would only see an increase. (This is from the study of differential equations.) Moreover, they need to interact in a way that includes growth and decay terms for each -- rather than, say, one group being gradually converted to the other. I'll leave the modeling aside for now and just note that any good model of invention needs these features.

Even at the level of the centuries-long trend up and down, we need these features. Aside from whatever interactions one generation has with another, which show up on the smaller time scale, it seems that there are two or more groups that people can fall into, and that interact to produce rises and falls over the centuries. For a long time, one of those groups appears to not even exist -- namely, before the Early Modern period. I'm reminded of Greg Clark's popularization of "the industrious revolution" in his book A Farewell to Alms, where English people suddenly became more industrious and future time-oriented, as a prelude to the Industrial Revolution. Under this view, there was a surge in the numbers of smart and hard-working people as the merchant classes genetically replaced the old aristocracy, which killed itself off through wars and feuds, the last of which was the War of the Roses in the late 1400s.

Institutions may matter too. The first patents were granted in Europe during the 15th C., although this requires believing in a century-long lag, given the dearth of inventions during the 15th C. -- it doesn't stand out against the previous 1400 years. At the same time, perhaps the effect took so long because patents -- governmental promises of protection -- mean little unless the state is powerful enough to deliver the tough protection it promised. And they weren't nearly as muscular in the 15th C. as they would become in the 16th.

Maybe it was modern centralized states and the rise of civil servants, bureaucrats, etc., which required new things to keep everything organized and flowing smoothly. Or more likely, it could have been the Military Revolution which began around that time -- the original military-industrial complex. Lots of cool gadgets are the direct fruit of military technology or are barely modified spin-offs (like commercial airplanes).

Whatever the genetic and institutional factors are, it's not hard to tell a plausible story about their decline in the late 20th C. Sure, elite fertility rates had been falling long before then (back to the 1700s in France), but maybe the invention rate is a saturating function of elite population size -- after the elite gets so big, no more inventors will be drawn from it, the rest preferring to go more into law, business, medicine, etc., or uncolonized career fields like community organizer. And certainly the decline in militarism, the skepticism of large state sectors of the economy, and an even greater disgust of monopolistic corporations than even the muckrakers had, all contribute to the decline in institutional support for invention.

Lamentably, the sociological view (even while grounded in individual's behavior) of interacting groups leaves little room for optimism. Given the right conditions on the parameters, the interactions between infected, uninfected, and recovered or immune people when an epidemic sweeps through may spell doom for the disease -- it will flare up but inevitably burn out, and there is nothing we can do to prevent that (a good thing). Of course, changing the parameters to some new combination may result in a qualitatively different outcome, such as the epidemic never infecting most people in the first place.

But we don't even know what the differential equations are that describe how invention changes over time, let alone have good estimates of the parameters involved. Still, gathering lots of data, seeing the rough patterns, and then making mathematical models, may eventually allow us to manipulate the invention rate just as we can affect the course of an epidemic with enough knowledge. That's really all we can do, and whatever extra power over society we get, we get.